Thank you for joining Scott Howard of Scott Howard Consulting and FM Academy in the webinar Demystifying Sub-summary Reports.
Every organization needs its software to generate reports: How many bags of coffee did we deliver by month? What are our year-to-date gross sales broken down by salesperson? (Can I see that also by Sales Manager?) Can we see every open project, its percentage complete by field technician?
FileMaker gives us some very powerful tools to create reports, but many developers find these abstract or difficult to apply to their situations. Over the years, the most frequent request from FileMaker developers who we train or who attend our Birmingham FileMaker Developers Group is to understand sub-summary reporting.
In this webinar we:
- Explain summary fields and sub summary parts;
- Build a simple sub-summary report;
- Add extra functionality to make more dynamic and easier to use.
- Demonstrate options for reporting in Preview vs. Browse modes.
- Show different things you can do with summary parts.
This webinar is aimed at:
- FileMaker developers and users who want a better grasp of summary reporting
- Business owners and manager looking for betters ways to present data from their business software.
Questions & Answers
Below are answers to most of the questions asked during the webinar. A few were more involved and will be added as time permits.
What happens if you click the Running Total box?
When setting up a summary field in Manage Databases or through the Report Wizard, when you select “Total of” and select a field to sum, the option to show a “Running Total” is below the field list.
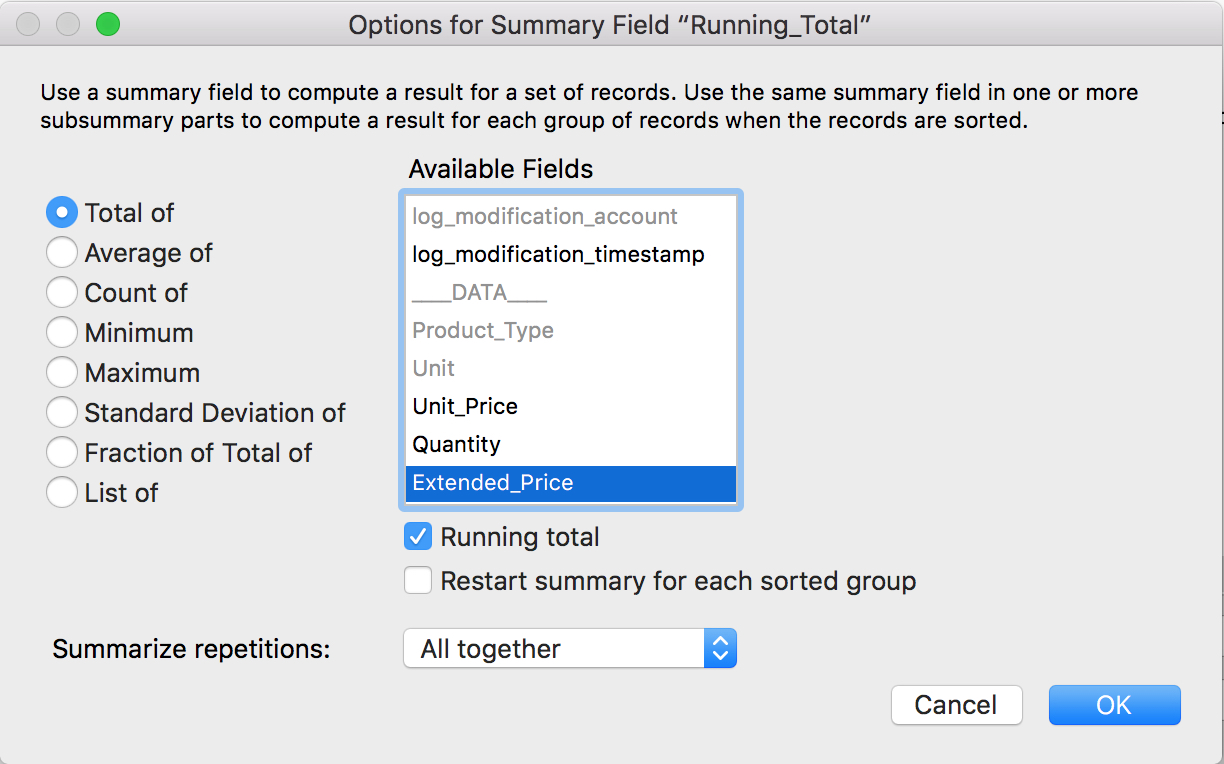
If checked, the summary field will show a running total of the field summarized. Think of a checkbook. You enter a check just written or deposit made and then in the last column you bring down the total. A “Running Total” will look like this, increasing or decreasing down the list of found records.
See this FileMaker Help entry about summary fields for all the options available for summary fields.
Is it possible to see the detail of just one category?
In the first summary report we built, every line item showed up under its Product Type when the found set was sorted by Product Type. Because the items are in a Body part, every line item will show up, however the found set is sorted. In the “false body part” example we could show or hide all items. There are ways to show items for one Type and not for another, but these are beyond the scope of this article.
How does your faux body part perform over the WAN?
Performance over the WAN or internet will usually be slower than over a local network. The design of the solution and report layoutOur simple example The faux body part should perform no differently than having a sorted body part over the WAN.
Can you use conditional formatting to change/hide the column headers? Most of yours don’t apply when the body part is “hidden?”
A: Yes, you can. In the last report we could create sets of column headers that show or hide based on our sort sections: one for when the report is sorted by Product Type and one when sorted by Salesperson or whether “Detail?” is checked or unchecked.
How did you show the details of the part item showing what it contained and how it was sorted?
When in layout mode layout parts have gray “handles” on the left. These can be shown closed up or extended horizontally to show you the part type and, if a Summary Part, the break field. You can toggle the way these “handles” display by clicking the small button at bottom left, just to the right of the Mode selector. Do view the Part Setup dialog, double click the “handle”, either way it is displayed.
If section extends over more than one page, how do you set up the paging so that no information is lost at the bottom of the report when printed?
FileMaker is good at splitting the text in summary parts so it shows correctly when the part crosses to another page. In earlier versions lines of text that fell on the page break could be split mid-line.
The key here seems to be that a sub-summary is not shown unless sorted by the associated field, correct?
This is true. Summary parts display only when the found set is sorted by the “break field” defined in the Summary Part.
When would you use a portal in the body?
There may be many reasons to show related data in a portal on a body part of a report, maybe to show the last few entries in a log, for example. Know that Portals do not “close up” in Preview mode so they will show blank rows if there are not enough child records to fill every portal row.
If you find yourself needing to show data from a portal in your body part, you may need to base your report on the table whose records you want to show in the portal. Then you can show records from your current body part as a sub-summary part.
When duplicating a report, and updating the fields and sort, is there any reason it doesn’t work? I always need to rebuild from scratch.
It is challenging to copy summary reports between files because you have to pay close attention to layout and summary field sizes and contexts. To troubleshoot your reports, make sure that both the original and your new copy layouts are based on the same table occurrence. Then check your Summary Part break fields to make sure they come from the same table occurrences.
We regularly copy summary reports from development to live solutions by follow these steps:
- Create a layout based on the same table occurrence (TO) as the development (source) file. Add the TO to the live (target) file if needed.
- Change the theme to match the source, if needed.
- Add any TOs and relationships needed for the report.
- Add all the parts needed in the new report, paying close attention to your Summary Part break fields.
- Size all parts exactly the same height in the target layout as they are in the source. I find it easiest to use the height field in the Inspector for this.
- Select All from the source and paste it your new target layout.
- Immediately after the paste, while everything is still selected, position the group of objects as they were on the source layout. Usually this is against the top and left edges.
- Check to make sure every objet is within its proper layout part and test.
Would the trigger fields be efficient if there are many sorting options?
In our example the triggers are not the problem, but the scripts they call. As you saw from the video, with each sorting choice the number of “If” statements double. If our report had contained a large found set, multiple summary field, perhaps some unstored calculation fields, the report the number of options could make the report slower.
Can you add date ranges to a sub-summary where you can put in start and end date?
We often include on report layouts start and end date global fields to let the users define the range of records on the report. If you mean that you want to break your found set by different date ranges, then this gets a little tricker. A Summary Part can only break by one field, so you might have to define a field to contain the range you want to break by.
Once common way to break dated records is by Month or Quarter or Year. To do this create auto-enter fields that calculate the month, quarter and year based on your date field. So you might have a number field named “InvoiceQuarter” set to auto-enter an invoice’s calendar quarter:
Ceiling ( Month ( InvoiceDate ) / 3 )
Now when you want to break invoices down by quarter, simply make a summary part with this field as the break field. One caveat here: if you report on quarters across several years, you must sort by InvoiceYear first, and create a Summary Part broken by InvoiceYear, then Quarter. If you sort only by quarter it will group all first quarters for every year into one summary line, then all second quarters, and so forth.
Can you show us the sub-summary you used to replace the body part? What context was used?
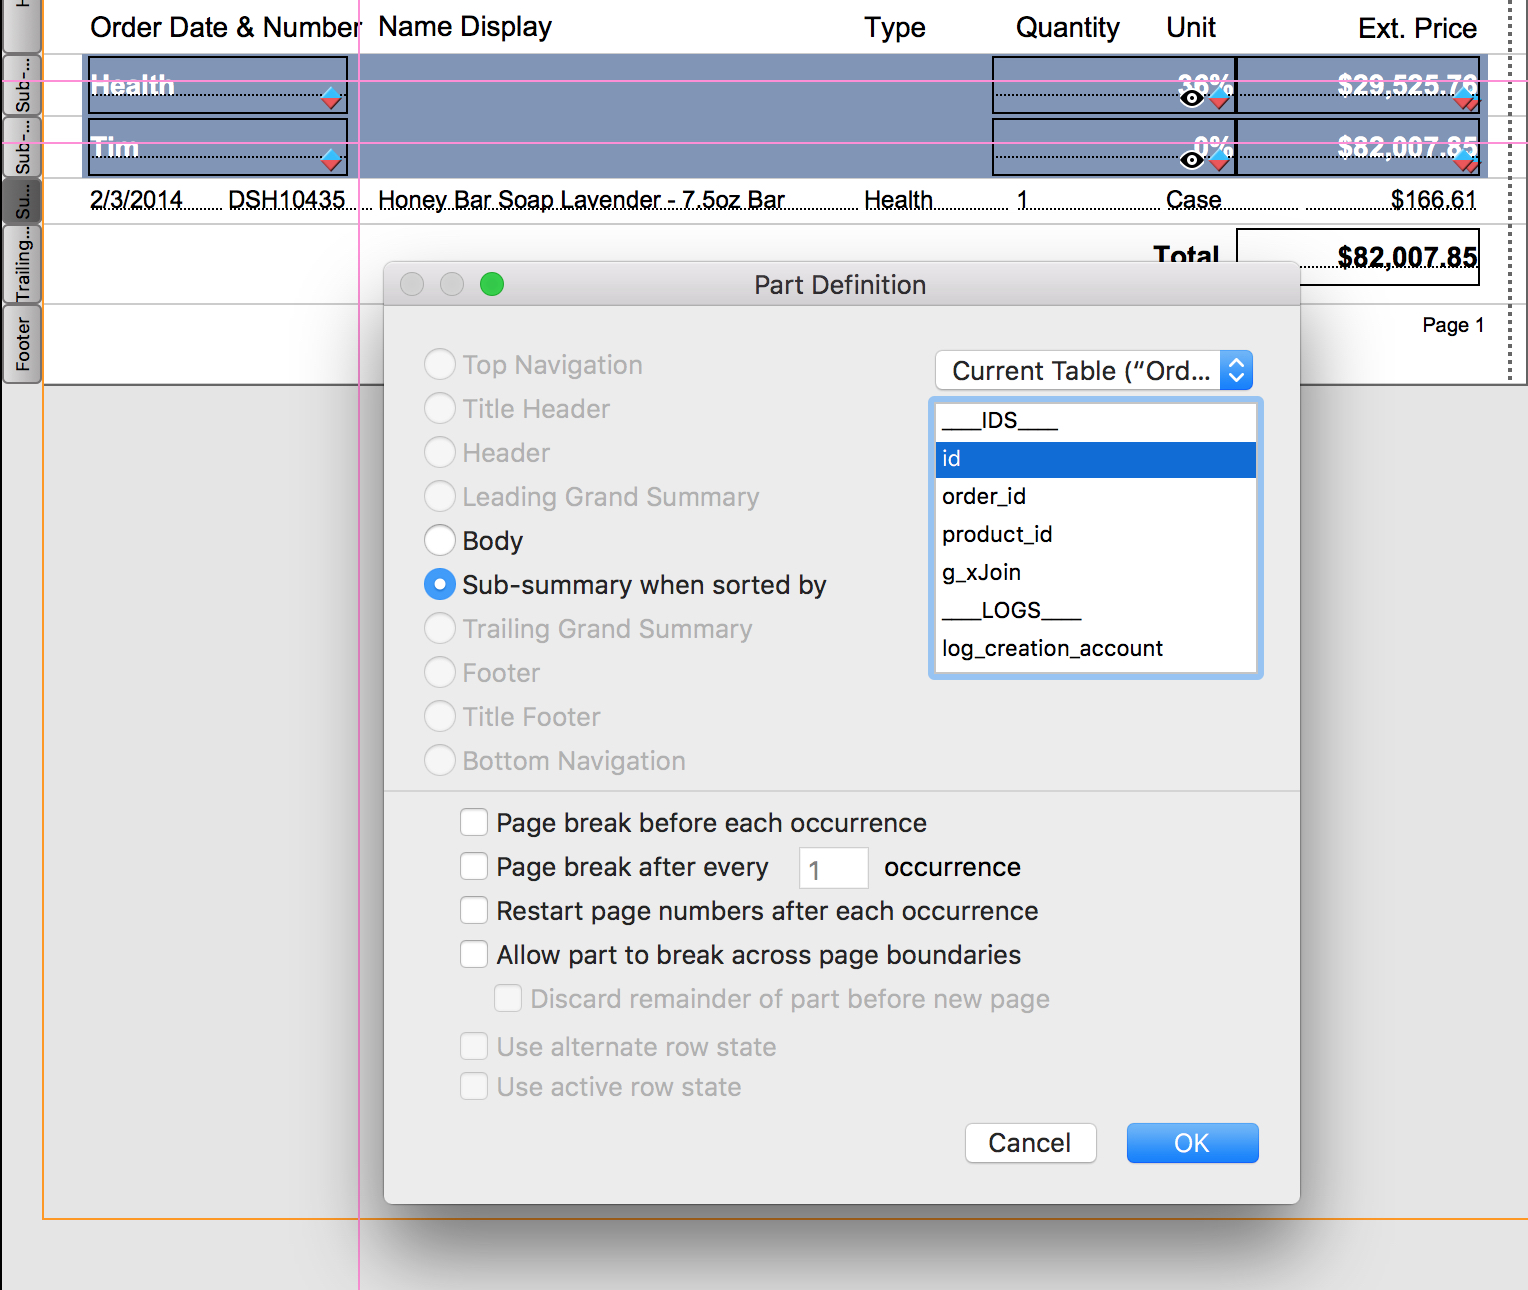
To show the “faux body part” for all fields the Summary Part must be broken by a field that is aways unique. Here I used the primary key field, “id”, but sorting by this field will not prove helpful to the user. They might want to see their items sorted by OrderDate or ProductName. If you sort by OrderDate and three items were sold on 2/1/2016, there will be only one faux line for all three records and the line will show data from the first record of the three. You could create a sort field that auto-enters the year, month, day and id like this:
2016-02-01-6FA82E11-C5D0-49F6-8929-6DD21DAF765B
This sorts on the date, then id, so every item record will show. But wait! FileMaker month and day numbers will show single digits with no leading zero, so this will not sort correctly because the calculated value will be sorted like text. To ensure that single digit days and months sort properly, you can use this calculation:
Year ( OrderDate ) & "-" & Right ( "0" & Month ( OrderDate ) ; 2 ) & "-" & Right ( "0" & Day ( OrderDate ) ; 2 ) & "-" & id
The “Right()” function puts the zero before a single digit month number.
How would you make a field have a hyperlink?
You cannot place hyperlinks within a field of text so that they are clickable. If the field contains only a link and you set it to not allow entry in Browse mode, you could define it as a button that opens the link in a browser. If the link is entered elsewhere, you can use a merge field on your layout and define it as a button. (In Layout mode press Insert > Merge Field. Alternatively, you can press CTRL + M on Windows or ⌘ + M on Macintosh. Right click the new merge field and select the option Button Setup. From here you can either select a script from your solution, or select “Single Step.” In the Button Action dialog, type “Open URL” and press enter.
Do you always create interactive reports like these?
Often, yes, depending on what the client needs. We like to give users as much control to view their reports in different ways. You can add many sub summary parts to a report layout to let the user generate what look like very different reports.
I noticed in your example there was a “?” for page number in Browse Mode.
Page numbers only calculate and display in Preview mode. In Browse mode they will show up as question marks. With hiding, sliding and multiple summary parts a report’s pages can render many different ways, so page numbers cannot be absolutely determined without going into Browse mode.
Can you help me understand the difference between charting/graphing in sub-summary vs. body vs. grand summary?
Charts will return different results when placed in different layout parts. FileMaker has a very helpful and comprehensive explanation of how charts work in different layout parts and with different data in this support article:
https://www.filemaker.com/help/14/fmp/en/html/create_chart.13.12.html
Can you please tell me the difference in using the sub summary fields in Leading & Trailing part?
The only difference between leading and trailing parts is where the part is displayed. Leading parts show up above the group of body parts, and trailing parts show up below.
Demo File
Click here to download the Deep South Honey demo file used in the webinar.
About the Sponsor and Presenter
This webinar is presented by Scott Howard, owner and Certified FileMaker Developer with Scott Howard Consulting and is offered by the FM Academy, a consortium of leading FileMaker development companies in the United States. All FM Academy members are platinum-level members of the FileMaker Business Alliance, and our purpose is to further educate FileMaker users and developers to encourage best practices and foster further adoption of the software.
